Description
This example uses the self-created Archiving & Visualization app which is based on a bottle filling process application from which data values are collected, stored in an Influx-Database (InfluxDB) and visualized via a Grafana dashboard.
General task
The Archiving & Visualization app collects data from an S7-1500 PLC by using the SIMATIC S7 Connector Configurator.
The collected data is automatically published to the Databus which is an internal MQTT broker of Industrial Edge. The Archiving & Visualization app uses a MQTT client (data collector) to subscribe to the Databus and write these values into an Influx-Database.
The time series of the collected data can then be plotted within the Grafana dashboard.
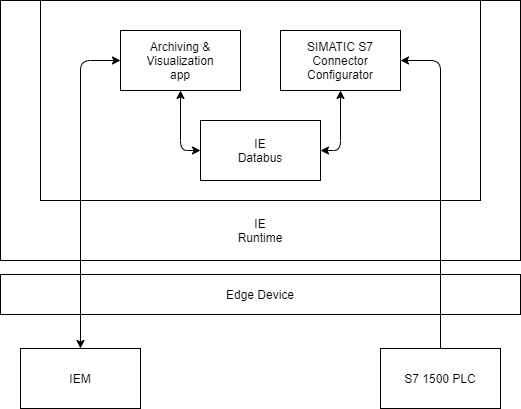
Structural overview
The following figure shows a simplified structural overview of this example: